LA Airbnb Analysis
NLP topic modeling on guest reviews plus a random forest on Superhost status, shipped as an interactive Tableau dashboard.
Two questions drive this project, and they need different tools. What makes a Los Angeles host a Superhost? is a classification problem. What are guests actually complaining about? is buried in unstructured review text. The answers meet in a dashboard a host can filter for themselves.
76%Random forest accuracy on Superhost status
74%Logistic regression accuracy
55K+Guest reviews topic-modelled
45K+LA listings in the dashboard
Host analysis
- Modeled Superhost status against response rate, acceptance rate, review scores, profile completeness, and hosting tenure.
- Compared logistic regression (74% test accuracy) against a random forest (76%). The forest won on accuracy; the regression won on explainability, and both agreed on the ranking of drivers.
- The controllable levers came out on top: high review scores, acceptance rate, and response rate. Tenure mattered far less than hosts tend to assume.
Review analysis with NLP
- Ran sentiment analysis across 55,000+ guest reviews to separate the language of high- and low-rated stays.
- Used Latent Dirichlet Allocation for topic modeling, surfacing the recurring themes behind poor reviews — cleanliness, check-in friction, and gaps between listing photos and reality.
- These are diagnosable problems. A host who reads "the shower pressure" in their topic weights knows exactly what to fix, in a way a 4.2-star average never tells them.
Interactive dashboard
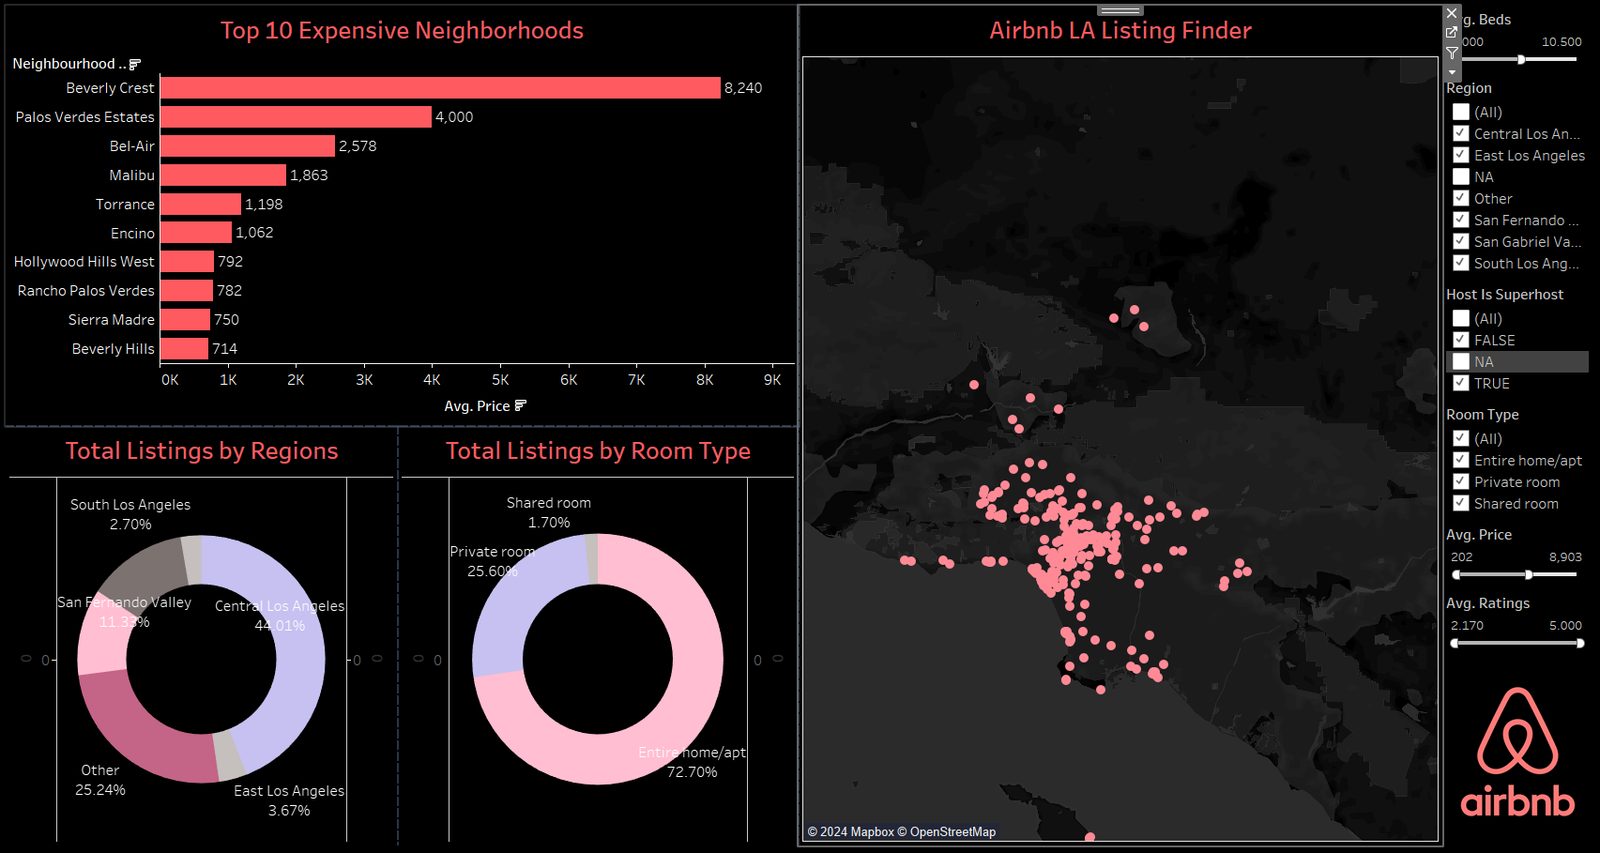
The listings side is published as a Tableau dashboard covering 45,000+ LA listings: price distributions by neighborhood and room type, listing density on a map, and filters for beds, region, Superhost status, price and rating.
If the embed does not load in your browser, the dashboard is also live on Tableau Public.
What I'd tell a host
- Protect the rating and the response rate before anything else — they are the strongest predictors of Superhost status and the ones fully under a host's control.
- Treat negative reviews as a topic model, not a tally. The same three or four issues repeat.
- Price against your neighborhood and room type, not against the LA average — the spread between Beverly Crest and the citywide median is an order of magnitude.